Let’s be honest we all want to know how well the shop, restaurant, or bar next door is performing? So here are all your Ecommerce benchmarks. From email KPIs to cost per acquisition, see how you stack up!
1. EMAIL PERFORMANCE
By 2022, Over 347 Billion emails will be sent every day. Your email channel is one of the highest performing, most cost-effective with the biggest return on investment.
According to Campaign Monitor, the average email benchmarks for all industries are:
- Average open rate: 21.5%
- Average click-through rate: 2.3%
- Average unsubscribe rate: 0.1%
- Overall conversion rate: 2.2%
The brands I work with that are outperforming these targets do the following;
1. Use thought-provoking headlines, “Must-haves this Summer”, “Top 5 reasons to…”
2. Make Call to Actions really clear. Not having a clear Buy Button on your email is like a meeting with no agenda, action items, or purpose.
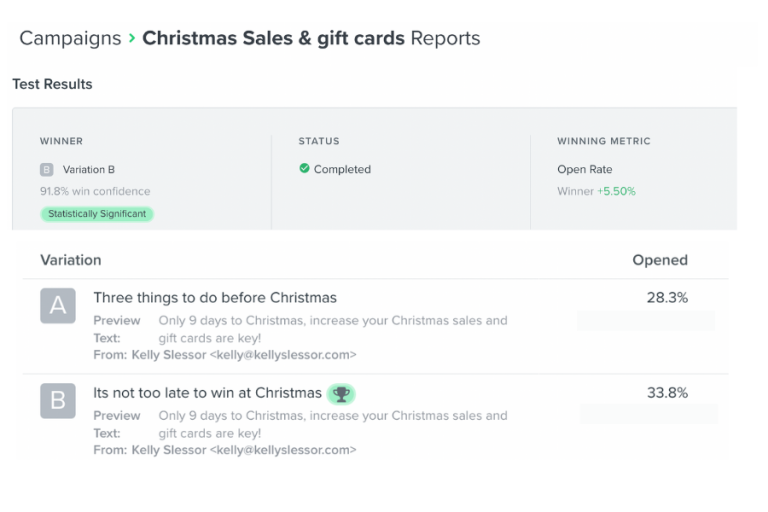
3. A/B split test your email campaigns so you can see which copy and headlines attract more open rates. It can increase your email marketing ROI by as much as 37%. Here’s one I prepared earlier……
2. ABANDON CART RATES
You spend all that time and money trying to get customers to your cart and then, according to Baymard research 69.57% will abandon it. The main reasons people leave your cart are; extra costs (shipping, taxes, fees), the checkout process is too long or too complicated, or no guest checkout. To reduce the leakage;
- Test your user experience make sure it’s quick, easy and straightforward– use autofill and only ask them the necessary fields needed at cart (2-3 things).
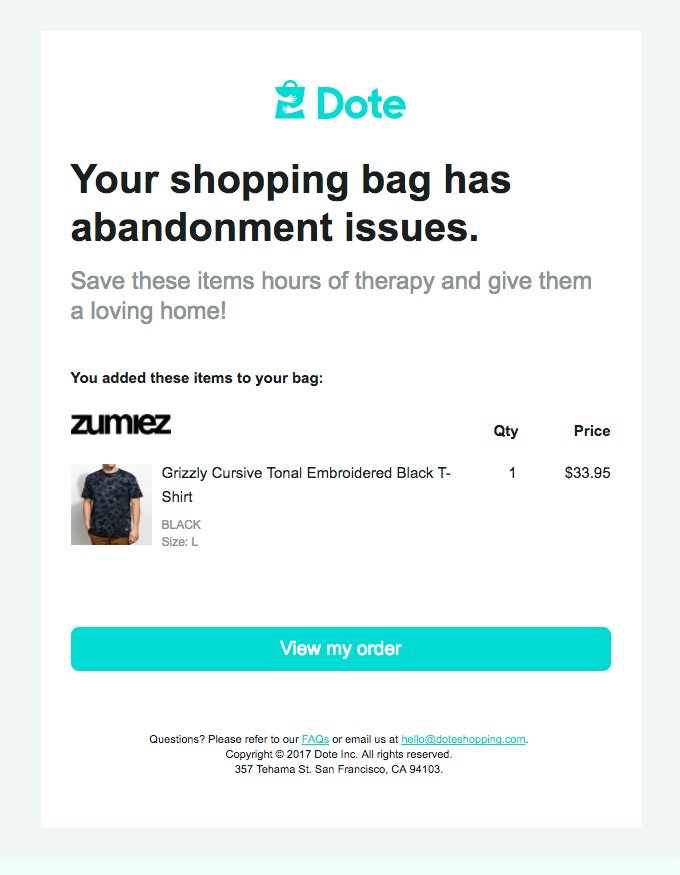
- Implement an abandon cart series- this allows the customer to have another chance to purchase that product as they are busy and have a million things to do.
3. SOCIAL MEDIA SALES
- Engagement rate per post – 0.08%
- Overall social media conversion rates – 1.0%
If you compare overall social conversion rates to email rates, you can see why building your own database (first-party data) is much more lucrative.
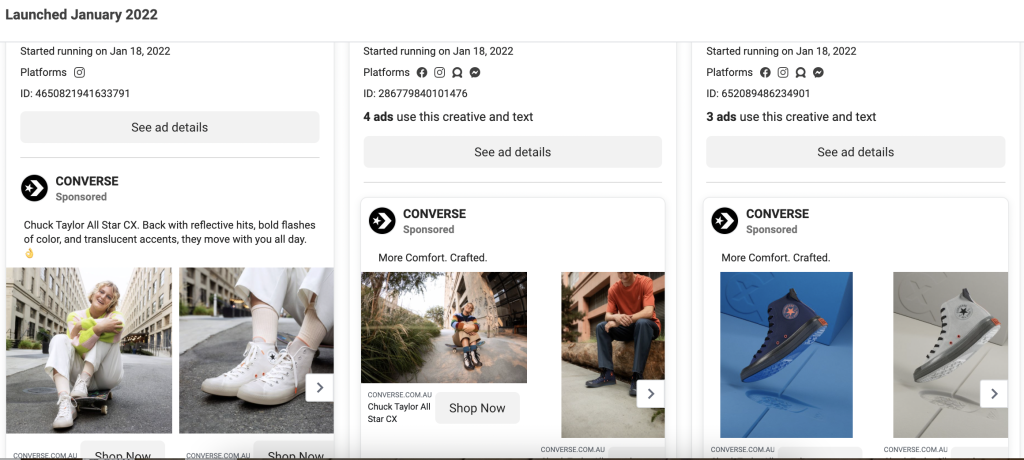
Stalking tip: you can check your competitor’s or other brands’ ads by going on their Facebook page, clicking page transparency, and then ad library.
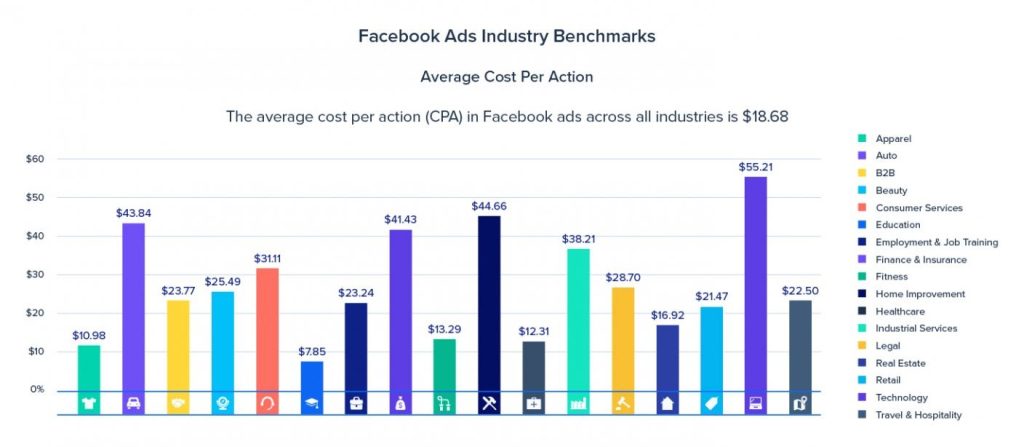
Cost per acquisition (CPA): The average CPA – the cost to acquire a paying customer for Facebook ads across all industries is $18.68. If not tracked properly these costs can escalate and erode your profit margin. The trick is to work out what you can afford to pay and keep your budget capped.
4. CONVERSION RATE
For me, this is the most important metric (after customer happiness of course) currently across the brands that I work with it’s sitting at around 2%. According to Smart Insights the UK is sitting at 4%, so there is a lot money being left on the table.
VALENTINES DAY INSPO
Good luck with your valentines day campaigns, if you are looking for Valentines Day email inspo check out Really Good Emails